Air Quality Campaign - Air Quality Campaign


Air Quality Campaign
Air quality measurements help scientists and researchers determine how clean or polluted the air is. The quality of air in your neighborhood, town or regional area can have significant impact on human health and environmental processes surrounding nearby communities. To help scientists and researchers monitor and compare air quality around the world, several GLOBE regions and countries have created Air Quality Campaigns, where students, teachers and citizen scientists can submit the air quality data they've gathered into GLOBE's database.
Regional Campaign Dates
- Asia and Pacific: November 2022 - January 2023
- Europe and Eurasia: See country-specific dates
- North America: September 2022 - May 2023
To learn more about specific events and initiatives in your region, check out the Regional Air Quality Campaigns page.
Note: If you're region isn't listed above, reach out to your Regional Coordination Office (RCO) to discuss creating an Air Quality data collection initiative in your region. Additionally, schools in these regions are encouraged to take air quality measurements during one or more of the campaign dates above to help provide regional data comparisons, support research and create collaboration opportunities.
Goals
- To create a better understanding of what air pollution is and how it travels through the atmosphere
- To gather data on local air quality and learn to present it in a clear and engaging way
- To critically review submitted data through comparison with satellite and ground monitor measurements
- To stimulate collaboration between GLOBE schools and professional scientists
How to Participate
Data Collection
During the campaign, you should gather air quality measurements of your local environment. To gather data, you can:
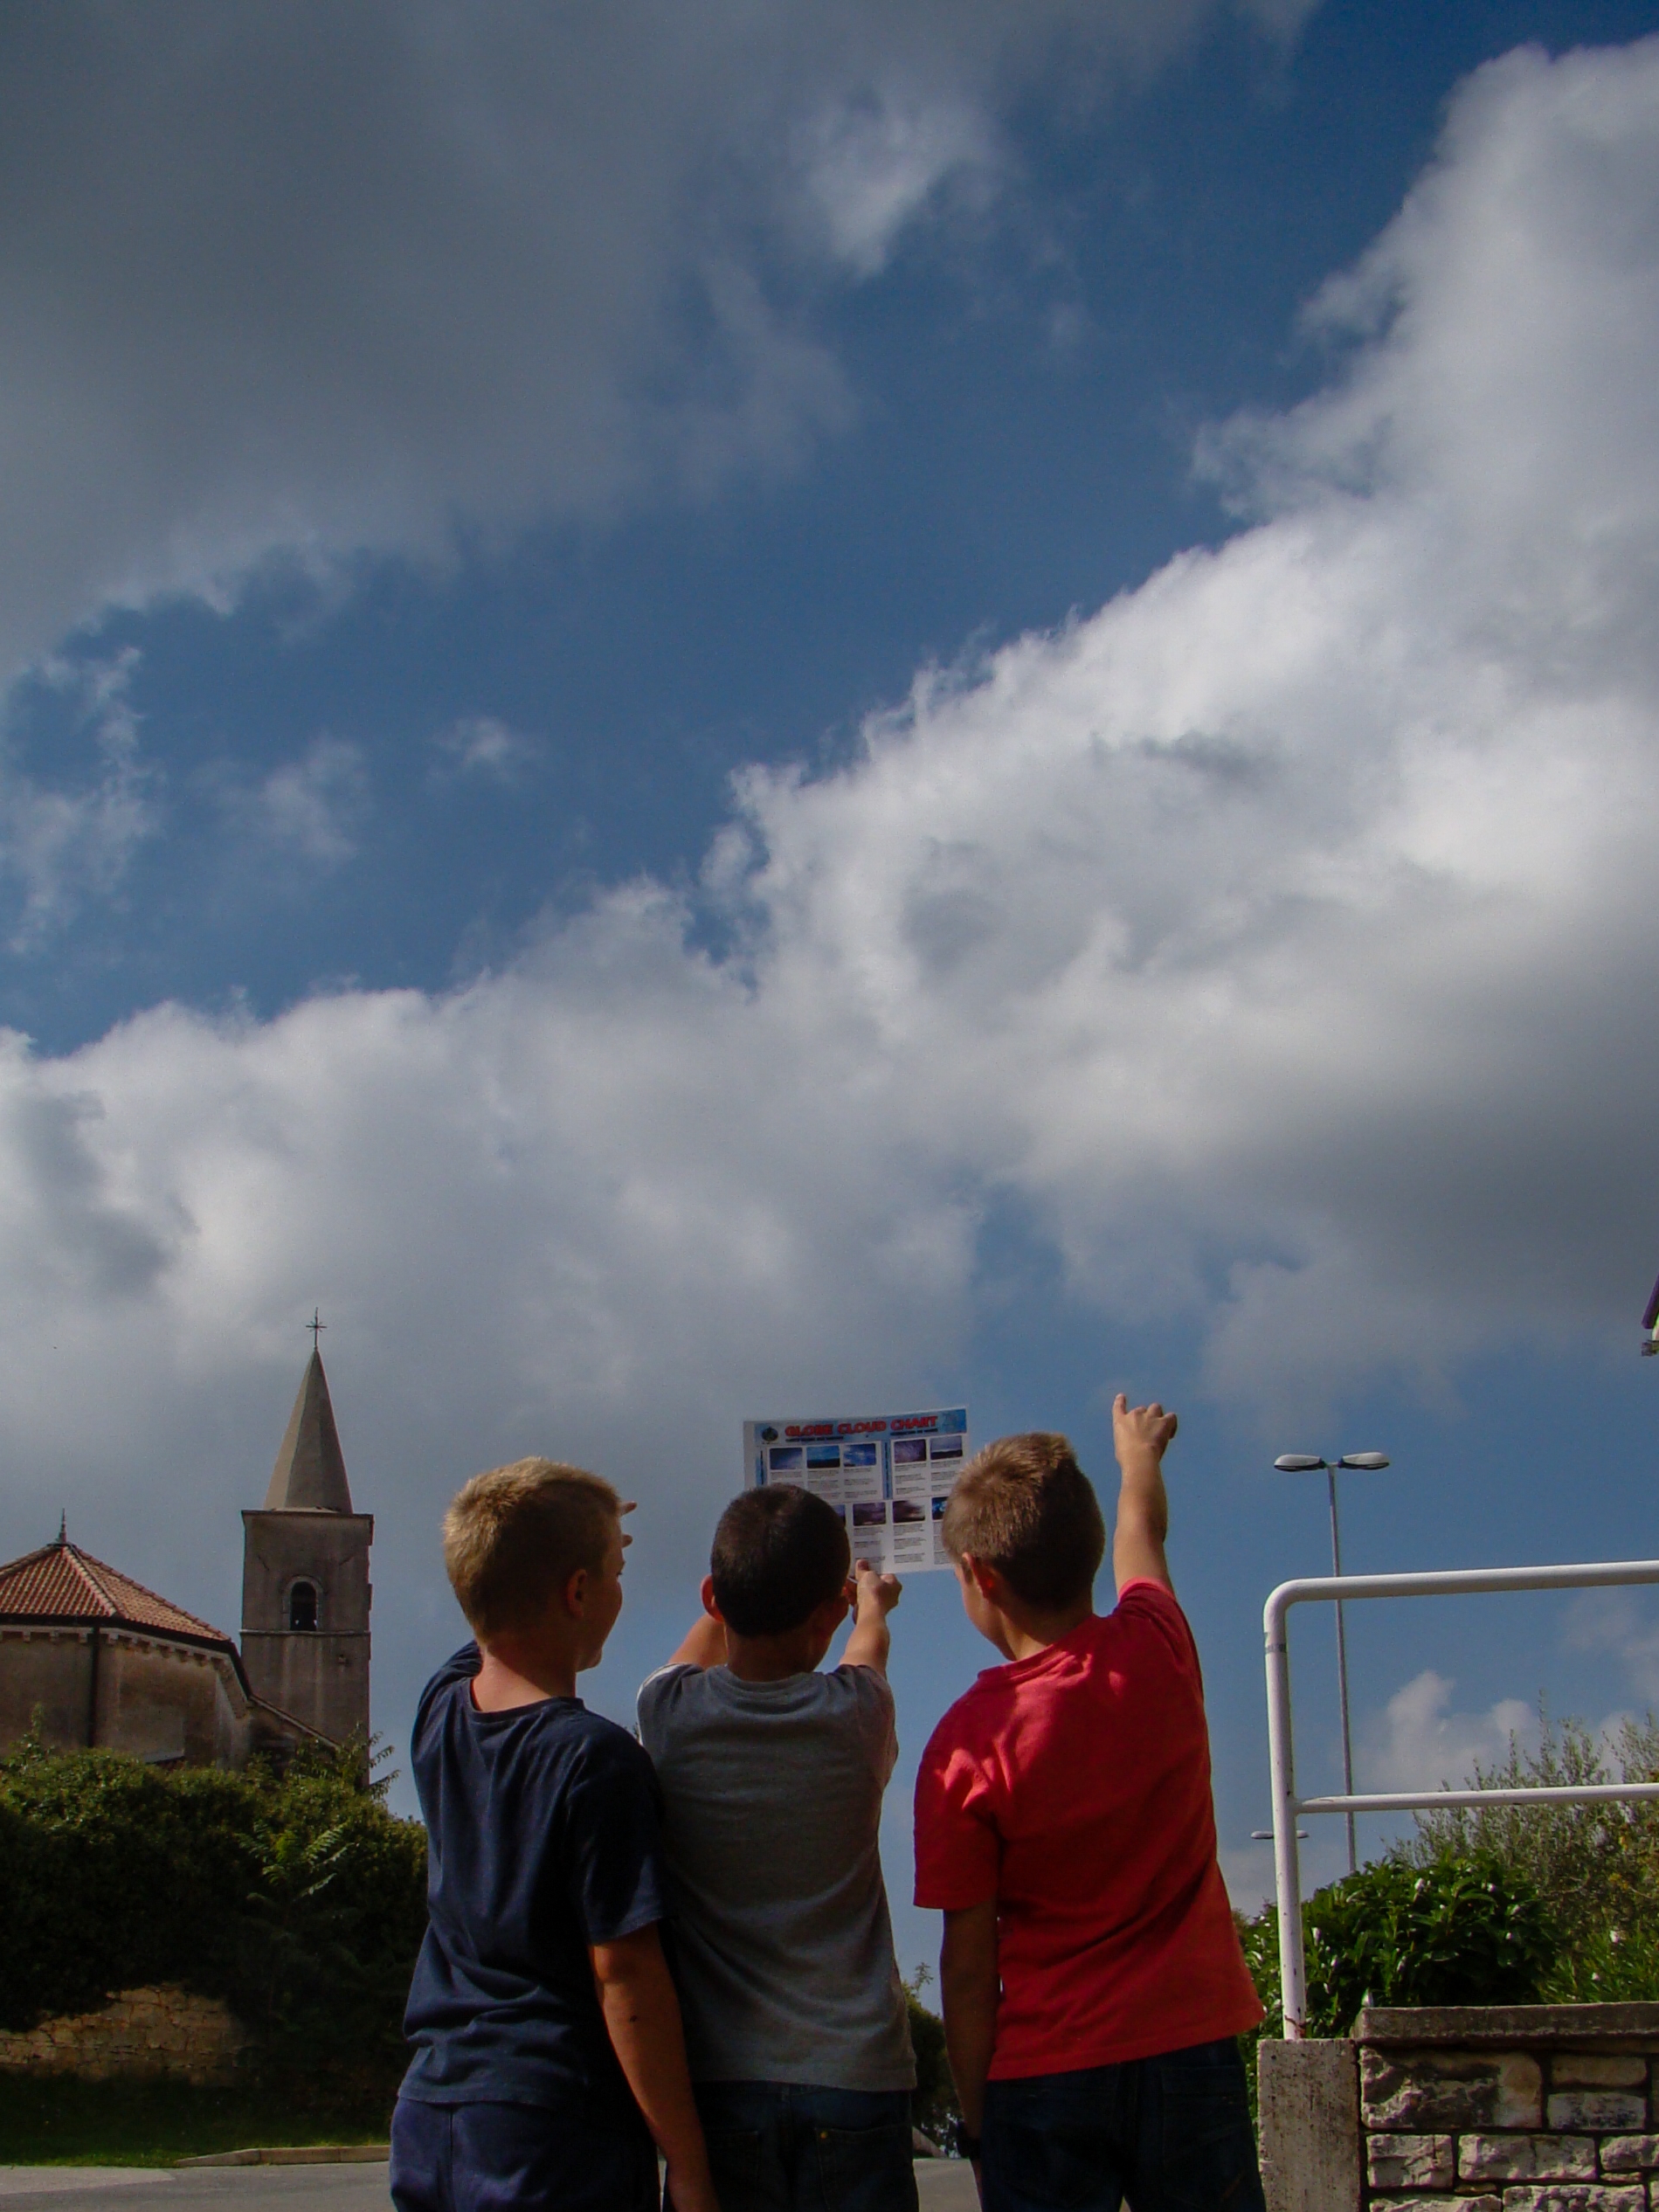
- Observe your local sky conditions, including color, visibility, clouds or any other relevant factor to create an intuition of the presence of aerosols
- If you have a sun photometer, you can measure the Aerosol Optical Thickness (AOT) of the atmosphere
Measuring Aerosol Optical Thickness (AOT)
To measure the amount of aerosols in the air, researchers and scientists measure the aerosol optical thickness (AOT) of the atmosphere. The AOT is a direct measurement of how much sunlight is scattered or absorbed by particles suspended in the air.
In order to measure the AOT for your project, you must use a sun photometer. Sun photometers will measure the amount of sunlight that reaches the ground when clouds are not covering the direct line from the observer to the sun. To learn more about sun photometers, check out the "Instruments" section of this page.
To learn how to take measurements of AOT:
- Download the Aerosols module
- Complete the online Aerosol Protocol eTraining
- Record your data using the Aerosol Data Sheet
Measuring Clouds
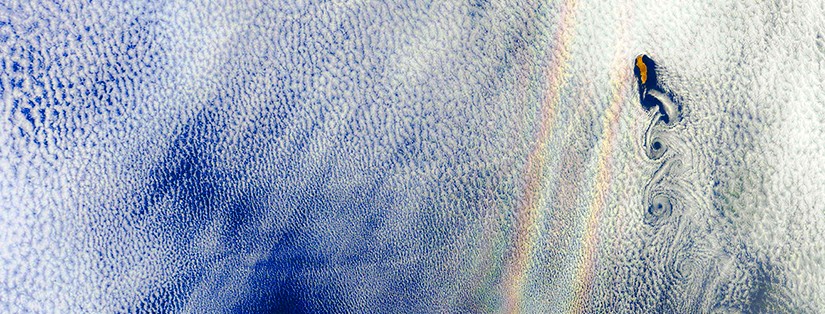
Clouds form in the presence of aerosols in the air. Aerosols on their own, and through the formation of clouds, influence Earth’s climate. For example, when large quantities of volcanic ashes are projected into the atmosphere, they can have a measurable cooling effect on the Earth’s climate.
To learn how to take measurements of clouds and sky conditions:
- Download the Clouds Module
- Watch the Why Observe Clouds? video by NASA
- Use the training material from the GLOBE Observer
- Use the Cloud Data Sheet to record data
Other Measurements
Besides AOT and Cloud measurements, students can also collect data on barometric pressure, air temperature and relative humidity, among other protocols. To learn more about additional parameters that may be included in an air quality campaign, check out the Atmosphere Protocol Page.
Research Questions
To help students and teachers begin their Air Quality research projects, GLOBE has compiled a list of research questions and potential methods to answer those questions. Check out the questions below to spark your curiosity and start generating research project ideas.
AOT Questions
- How does AOT vary during a week, month and season in your area?
- Take sun photometer measurements at the same time every day on consecutive clear sky days throughout the measurement period
- How does AOT vary in a single day? In the spring? In the fall?
- Take multiple sun photometer measurements in a single day. If possible, take the measurements at equal intervals throughout the day
- How does AOT vary throughout your country, GLOBE region and around the world?
- Compare observations collected at the same local time but at different locations
- What can you observe and how does that compare to satellite measurements?
- Compare your AOT observations with those from MODIS satellite instrument. To learn more about satellite verification, check out the "Analyze Your Data" section of this page.
- Compare your AOT observations with those from MODIS satellite instrument. To learn more about satellite verification, check out the "Analyze Your Data" section of this page.
Cloud Questions
- Do cloud patterns or parameters change throughout the year?
- Explore the “All Cloud Types” or “Cloud Cover” layers in satellite imagery
- Does the amount of cloud cover affect the local temperature?
- Explore the cloud layers as mentioned in question 1 and correlate the results with air temperature protocols
- How do the clouds you see relate to nearby mountains, lakes, large rivers, bays, or the ocean?
- Explore the cloud layers as mentioned in question 1 and correlate the results with maps or satellite imagery
- How do our cloud observations compare with satellite images of clouds?
- Explore NASA or NOAA resources. If there’s a satellite measurement made at the same time over your location, you will receive satellite imagery that you can use to explore this question.
Data Submission
After you collect your data, you can share your measurements with the GLOBE community. To share your measurements, you can submit your collected data through either:
Sun Photometer Measurements
If you are submitting data measured with a sun photometer, follow the instructions below:
- Log in to the GLOBE Data Entry page
- Select the study site for your school
- select the "Aerosol Observation" protocol
- Enter the date and time of your measurements
- Answer the question, "Does your photometer measure AOT directly?"
- If you select "Yes," select a photometer manufacturer
- If you select "No," manually enter a photometer serial number. The serial number will be verified against an internal database, so make sure you enter a valid number.
- Complete all required fields where you have gathered data
- Select "Send Data"
- To print your observations, select "Print this submission"
- To start a new observation, select "Create a new one." Alternatively, select "Data Entry Home" to return to the home page and repeat the process above.
For more information about entering data into the GLOBE database, check out the data entry tutorials page.
Review Your Results
At the end of the campaign period, you can conduct a review of your data and create a short report of your results. All the student measurements submitted to GLOBE's database can be accessed from anywhere in the world, enabling you to compare your results with other students and schools. To explore how to compare your data to others using the GLOBE database, you can check out the GLOBE Visualization Tool and the GLOBE Visualization User Guide.
Analyzing Your Results Using Calitoo
If you're taking measurements using a Calitoo sun photometer, you can use the Calitoo software to study your gathered data. To learn more about using the Calitoo products in your research, check out the GLOBE guides below:
Using Satellite Data Verification for Results Analysis
An important aspect of Air Quality analysis is correlating ground-truth measurements with those taken from satellites.
Correlating Overpass Times
If you want to compare your observations with real-time satellite data, you must take your measurement around the same time that a satellite is orbiting overhead. To determine satellite overpass times at your location, you can use the NASA Satellite Overpass Calculator.
Interactive Visualization Tool
NASA's GIOVANNI Interactive Visualization and Analysis tool allows the community to explore a wide range of Earth observation data from instruments on NASA satellites. To explore how to download data from the Terra and Aqua satellites, you can check out the GIOVANNI How To article.
Learn more about NASA Satellite Missions and The GLOBE Program.
There is a range of equipment you can use to take air quality measurements in your local habitat. Check out the instruments below to determine which ones are most appropriate for your study.
Cloud Identification Chart
- Measures: Sky conditions
- Description: A downloadable chart to assist users in identifying various type of clouds, sky color, sky visibility, cloud opacity and cloud cover.
- Download the Cloud Identification Chart.
Calitoo Sun Photometer
- Measures: Aerosol Optical Thickness
- Description: A handheld instrument that measures the aerosol optical thickness by directing the device at the sun. The calculation of optical depth, as detailed in the user manual, is completed by using the raw brightness measurement, calibration coefficients, date, GPS position and the atmospheric pressure.
- Learn more about the Calitoo.
PurpleAir Air Quality Sensors
- Measures: Particulate Matter (PM) 2.5
- Description: A mounted device that measures PM 2.5 by connecting to a network of other sensors through a WiFi connection. Users can take snapshots of air quality at any time on the network map and explore air quality measurements around the world.
- Learn more about PurpleAir Sensors.
Other Ways to Get Involved
- Join your local Air Quality Campaign community to receive regular updates and alerts on aerosols events
- Participate in your regional News and Discussion pages to exchange results and find opportunities for collaboration
- Find a scientist or STEM professional in your country and introduce them to the GLOBE Air Quality Campaign
Contact
For more information on the Air Quality Campaign within your country, you can contact your respective Regional Coordination Office below:
- Africa: africa.region.globe@gmail.com
- Asia and Pacific: ap.region.globe@gmail.com
- Europe and Eurasia: ee.region.globe@gmail.com
- Latin America and Caribbean: lac.region.globe@gmail.com
- Near East and North Africa: nena.region.globe@gmail.com
- North America: naro.globe@gmail.com